


Gold Rate
(Expiry: 04-Dec-2026 | Exchange: MCX | Head: Precious Metals)03.35PM IST | 19 Nov, 2026
- 129172.0Per 10 GRMS
- Change
-642.00 (-0.49%)
- Volume5872
- Open128320.0
- Prv. Close129814.00
- Spot75340.00
Day's Trend
- Day:
- Contract:
- Average Price (Rs/10 GRMS):129280.29
- Open Interest (Contracts):12275
- Open Interest Change %:-7.95%
- Best Buy Price (Rs/QTY):129157.0/5
- Prem/Disc:
- Spread:
- Unit:KGS
- Lot Size:1
- Tick Size:100
- Best Sell Price (Rs/QTY):129195.0/6
GOLD News
4x Return: How buying 1 gram of gold every Dhanteras for 21 years built wealth | News
6 Nov, 2026, 02.05 PM
Over the past 21 years, investing in gold and silver each Dhanteras has proven to be a wise strategy for wealth enhancement. An initial investment of Rs 76,246 in gold has appreciated to Rs 3,02,400, while silver investment has surged from Rs 1,05,329 to Rs 3,94,800. This trend underscores the importance of steadfast and systematic investing, yielding favorable results despite the ups and downs of the market.
ETMarkets Smart Talk| Gold, silver or copper? Tata MF fund manager suggests a 50:30:20 commodity allocation: Tapan Patel | News
5 Nov, 2026, 09.50 AM
In this edition of ETMarkets Smart Talk, we speak with Tapan Patel, Fund Manager – Commodities at Tata Asset Management, who shares his outlook on gold, silver, copper and crude oil, explains the changing dynamics driving commodity prices, and suggests a 50:30:20 allocation to gold, copper and silver, respectively, for investors looking to build a commodity portfolio for the long term.
Gold prices rise for 2nd day, silver up Rs 3,500/kg on soft dollar ahead of inflation data | News
8 Sep, 2026, 10.11 AM
Gold and silver traded higher internationally as the US dollar weakened, while MCX prices were mixed, with silver gaining and gold declining. Investors awaited US inflation data for clues about the Federal Reserve’s next policy move amid geopolitical tensions.
Gold extends losses, falls to nearly Rs 1.54 lakh/10 gm. Time to buy? | News
19 Aug, 2026, 10.23 AM
Gold prices slipped on the MCX but edged higher internationally as easing Treasury yields supported demand. However, rising oil prices and renewed inflation concerns could limit the scope for US rate cuts, weighing on gold. With traders pricing a 35% chance of a September rate hike, experts Christopher Wood and John Paulson see the recent correction as a buying opportunity.
Gold rises for third straight session, inflation prints in focus | News
11 Aug, 2026, 07.33 AM
Gold has reached its highest point in two months, driven by traders evaluating significant upcoming U.S. inflation data that may influence interest rate decisions. Lacking favorable job growth numbers has diminished prospects for a Federal Reserve increase, propelling interest toward non-yielding gold.
Gold softens on prospects of Fed rate hikes as Brent tops $100 | News
24 Jul, 2026, 07.15 AM
Gold prices edged lower on Friday, impacted by rising crude oil prices. Inflation concerns and higher interest rate expectations are strengthening the case for rate hikes. U.S. Treasury yields reached their highest levels since January 2025. Traders are pricing in an 81% chance of a September rate hike. Other precious metals like silver, platinum, and palladium also saw declines.
Gold prices fall Rs 1,300/10 gram; silver tanks Rs 5,600/kg as rate hike bets, US-Iran tensions dent mood. Time to sell precious metals? | News
10 Jul, 2026, 02.42 PM
Gold and silver prices tumbled on Wednesday as fading hopes for a U.S.-Iran peace deal fueled inflation worries and bolstered expectations of sustained high interest rates from the Federal Reserve. MCX silver futures saw a significant drop, while gold futures also declined. Analysts advise caution, suggesting investors await the Federal Reserve Chair's speech before making new moves in the volatile precious metals market.
Gold prices fall Rs 2,200/10 gms; silver tanks Rs 3,300/kg as rate hike fears outweigh falling oil prices. Key levels to watch | News
24 Jun, 2026, 09.44 AM
Gold and silver prices fell sharply on MCX on Wednesday as a stronger U.S. dollar and rising expectations of Federal Reserve rate hikes dampened sentiment, outweighing support from easing oil prices and the gradual reopening of the Strait of Hormuz.
Gold on course to log worst yearly fall since 2013 if West Asia troubles continue. Time to sell? | News
16 Jun, 2026, 07.17 PM
Gold has fallen over 25% from its peak despite ongoing geopolitical tensions in West Asia, marking a sharp divergence from its traditional safe-haven role. Profit booking after a strong rally, expectations of higher interest rates, a stronger dollar and elevated bond yields have driven the decline. Analysts, however, say central bank demand and macro uncertainty continue to support its long-term outlook.
Gold prices dip Rs 1,600/10 gm, silver crashes Rs 5,000/kg after rising oil prices amid West Asia tensions. Time to sell? | News
16 Jun, 2026, 06.38 PM
Gold and silver prices opened lower on MCX Thursday. Fresh Middle East tensions and rising oil prices impacted sentiment. US attacks on Iran contributed to the decline. MCX silver futures for July 2026 delivery fell significantly. Gold futures for August 2026 delivery also slipped. Soaring inflation amid the West Asia crisis is another concern.
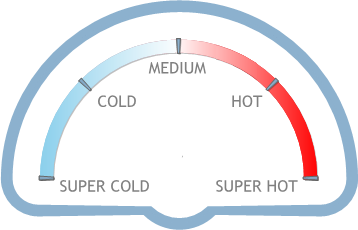
Hot/Cold Gold Contract
GOLD (MCX)
04 December 2026

GOLD Spot Rate Details
GOLD vs Other Precious Metals
Trend
D | M | YGOLD vs Peers (Intraday Range)
LowestHighest
-6.630.12
-0.36
GOLD vs Peers (Contract Range)
LowestHighest
-47.42-0.33
-27.17
GOLD (05-Feb-2027) vs GOLD Other Contracts
GOLD Contract Details (2026-12-04) Exchange: MCX
Symbol
GOLD
Contract Start Date
2025-12-16
Last Trading Date
2026-12-04
Lot Size
1
Tick Size
100
Symbol Description
GOLD 995
Delivery Start Date
2026-12-02
Delivery End Date
2026-12-07
Symbol Info
GOLD 995 EX AHMEDABAD
Tender Period Start Date
2026-12-02
Tender Period End Date
2026-12-04
Commodity Group
Precious Metals
Name Of Underlying
Precious Metals
Identifier of the Underlying
114
Instrument Identifier
495213
Instrument
FUTCOM
Expiry Date
2026-12-04
Price Quote Qty
GRMS
Daily Price Percent
0.00
Near Month Instrument Identifier
-1
Far Month Instrument Identifier
-1
Trading Unit
KGS
Delivery Unit
KGS
GOLD Rate Historical Performance

Future Margin Calculator
This is the minimum amount which is required to buy "x" number of lots of a particular commodity to trade in futures market.
Mark-to-Market Calculator
This is daily gain/loss on the position which is taken in derivatives market, it is calculated on daily basis till the time that position is not squared off.

